
Will the bull market persist or is the bear market at the door?
Will the bull market persist or is the bear market at the door?
Abraham George Macro Analysis
One of the biggest debates that is circulating in the markets right now: are still in a bull market or are we seeing the beginnings of a bear market? There was a lot volatility in the markets yesterday but before we discuss that let’s touch on something that we have never discussed here before.
While the debate on markets is very hot, there is another debate going on at the Capitol Hill. It is about the debt ceiling. This is something that happens every year and finally it gets resolved.
If the US government defaults on its debt, nothing short of an economic crisis will follow in the short term. (whether the default is better for the economy in the long term is another story).
For now, if the Congress doesn’t raise the debt ceiling (for that matter it has been raised roughly 100 times since the creation of the Congress), the US Treasury won’t be able to pay any bills in a couple of weeks. The standoff between both parties did create some panic in one year during the Obama years when most Congressmen went on holiday and the stock markets fell down 4 or 5 pct which was recovered shortly. But every year around this time, they create so much drama as if they have no other choice other than raising the debt ceiling.
This time around the Republicans have already said the Democrats can raise the debt ceiling on their own with simple majorities in the House and Senate. The Democrats just don’t want to do that. They want to accord the Republicans a little more respect and use it more as a negotiating chip in their infrastructure and general government funding talks which is coming down the pike. Nonetheless, discussions on the debt ceiling is a reminder how massive debt can be dangerous especially when it is mishandled, monetized and politicized.
Another thing of importance is for the first time since Feb 2020, the five year treasury yields moved above 1% and the ten year has made a steep move to 1.55% since June. Actually the yields are still at historic lows and they are negative in ‘real’ terms when accounting for inflation.
In higher rate environments, entities like banks that borrow at lower short term rates and lend at higher long term rates make more money. So do companies that have pricing power because of high demand. Conversely, as borrowing costs rise with higher rates, companies that borrow a lot of money to fuel growth like technology firms will be negatively affected.
A good measure of the economy is to look at the yield curve. The most common method is to look at the difference between the benchmark 10 year treasury notes and the two year notes. Long term interest rates are higher and rising to short term rates implying investors are being compensated for tying up their money for a longer period of time. This is healthy and it is also called as the ‘steepening’ of the curve. The difference between the 10 year and 2 year today is at 1.17 up from the recent low at 0.98 in July. The 0.19 rise is not a lot but in percentage terms it is 20%.
Uncertainty looms over the markets when the curve flattens or when it inverts as bank margins will continue to shrink. An inverted yield curve is also a sign of a pending recession that could be ahead of us. The last time we had an inverted yield curve was in Aug 2019 six months before we embarked into the pandemic induced recession.
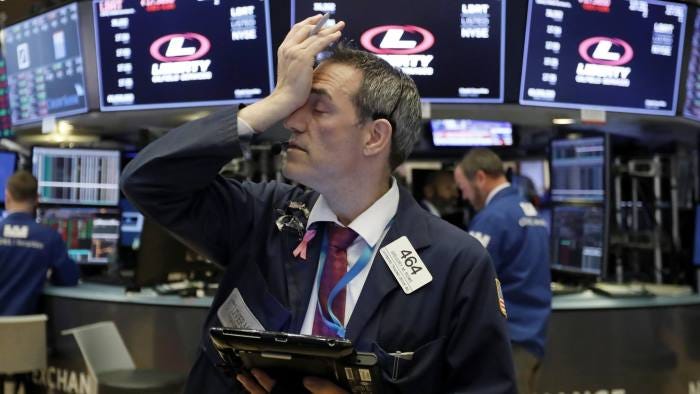
Let’s turn to markets. Yesterday, the NASDAQ was down 400 points which is nearly 3% and the S&P 500 2%. We are not used to this kind of daily swings since the new administration came to power.
In my report Evergrande, contagion and Fed policy, we highlighted that the markets have broken below a smooth 45 degree angle trendline which held a 40% rise in markets since the election. Apart from the market being short-term overbought, a few factors have contributed to this break down. Firstly, the upcoming change in Fed policy; secondly, the concern about the Chinese financial system and thirdly, uncertainties surrounding the US government shut-down.
After a break down of nearly 5 pct, we moved up to test the trendline and we are moving down again. As outlined before, this move down can go to test the 200 day moving average which normally acts as an yearly dynamic trend line and the correction to be around 10%.
I reckon those are good levels to buy considering all the fiscal stimulus that is in the pipeline which I’ve already discussed in length.
So, there we go. Thanks for reading Breezy Briefings. If you enjoyed this, I'd really appreciate if you could take a second and tell a friend. Honestly. It makes such a big difference.
Forward this email. Recommend the newsletter. Share on Twitter, WhatsApp, LinkedIn, Slack, wherever!


Abraham George is a seasoned investment manager with more than 40 years of experience in trading & investment and portfolio management spanning diverse environments like banks (HSBC, ADCB), sovereign wealth fund (ADIA), a royal family office and a hedge fund.